Adult obesity prevalence by U.S. state and territory, 2024
An independent, publication-ready presentation of CDC Behavioral Risk Factor Surveillance System estimates, with 95% confidence intervals, downloadable data and a transparent 2011 comparison.
Obesity is defined here as BMI ≥30. Estimates use self-reported height and weight. BMITDEE is not affiliated with or endorsed by CDC.
How prevalence differs across the country
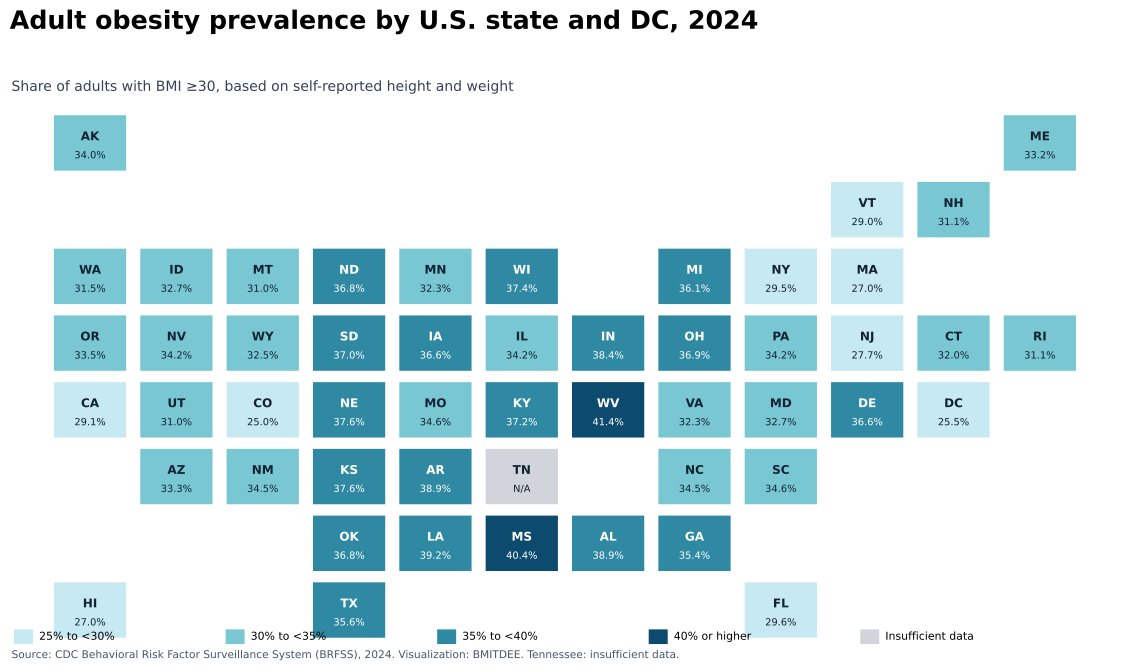
Select a state or DC. The tile layout prioritizes readable comparison; it is not a geographic map.
Puerto Rico, Guam and the U.S. Virgin Islands are included in the downloadable table below but not in this state tile layout.
What the 2024 estimates show
Search and compare every location
Includes 49 states with estimates, DC, three territories and Tennessee's insufficient-data status.
| Location | Region | 2024 estimate | 95% CI | Visual | 2011 | Difference |
|---|
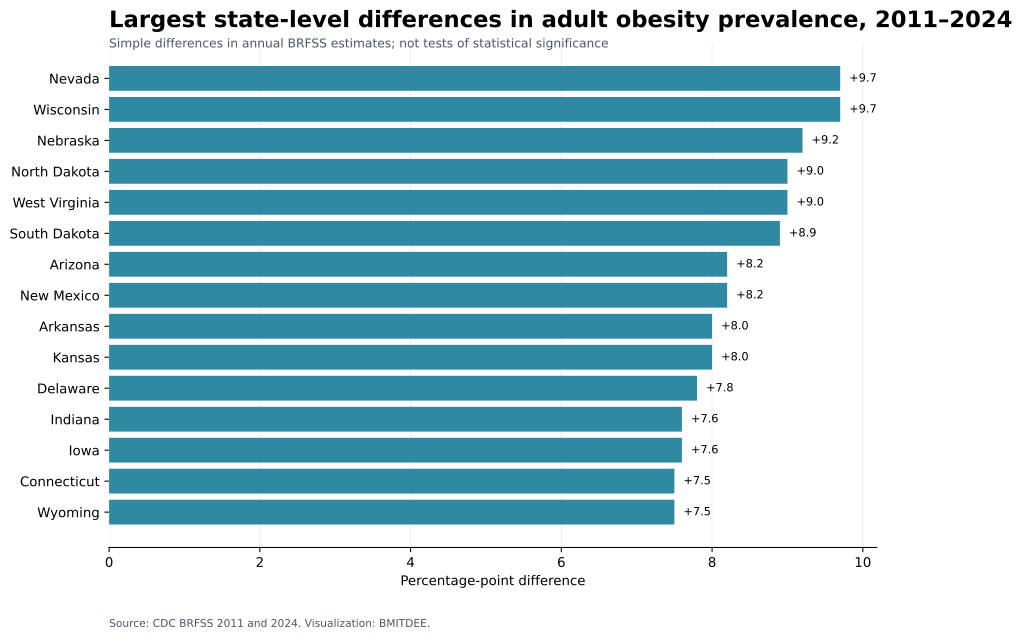
“Difference” equals the 2024 estimate minus the 2011 estimate. It should not be interpreted as a statistically significant trend without appropriate survey analysis.
Publication-ready media package
Reuse the BMITDEE charts with attribution. Retain the source and methodology note when editing.
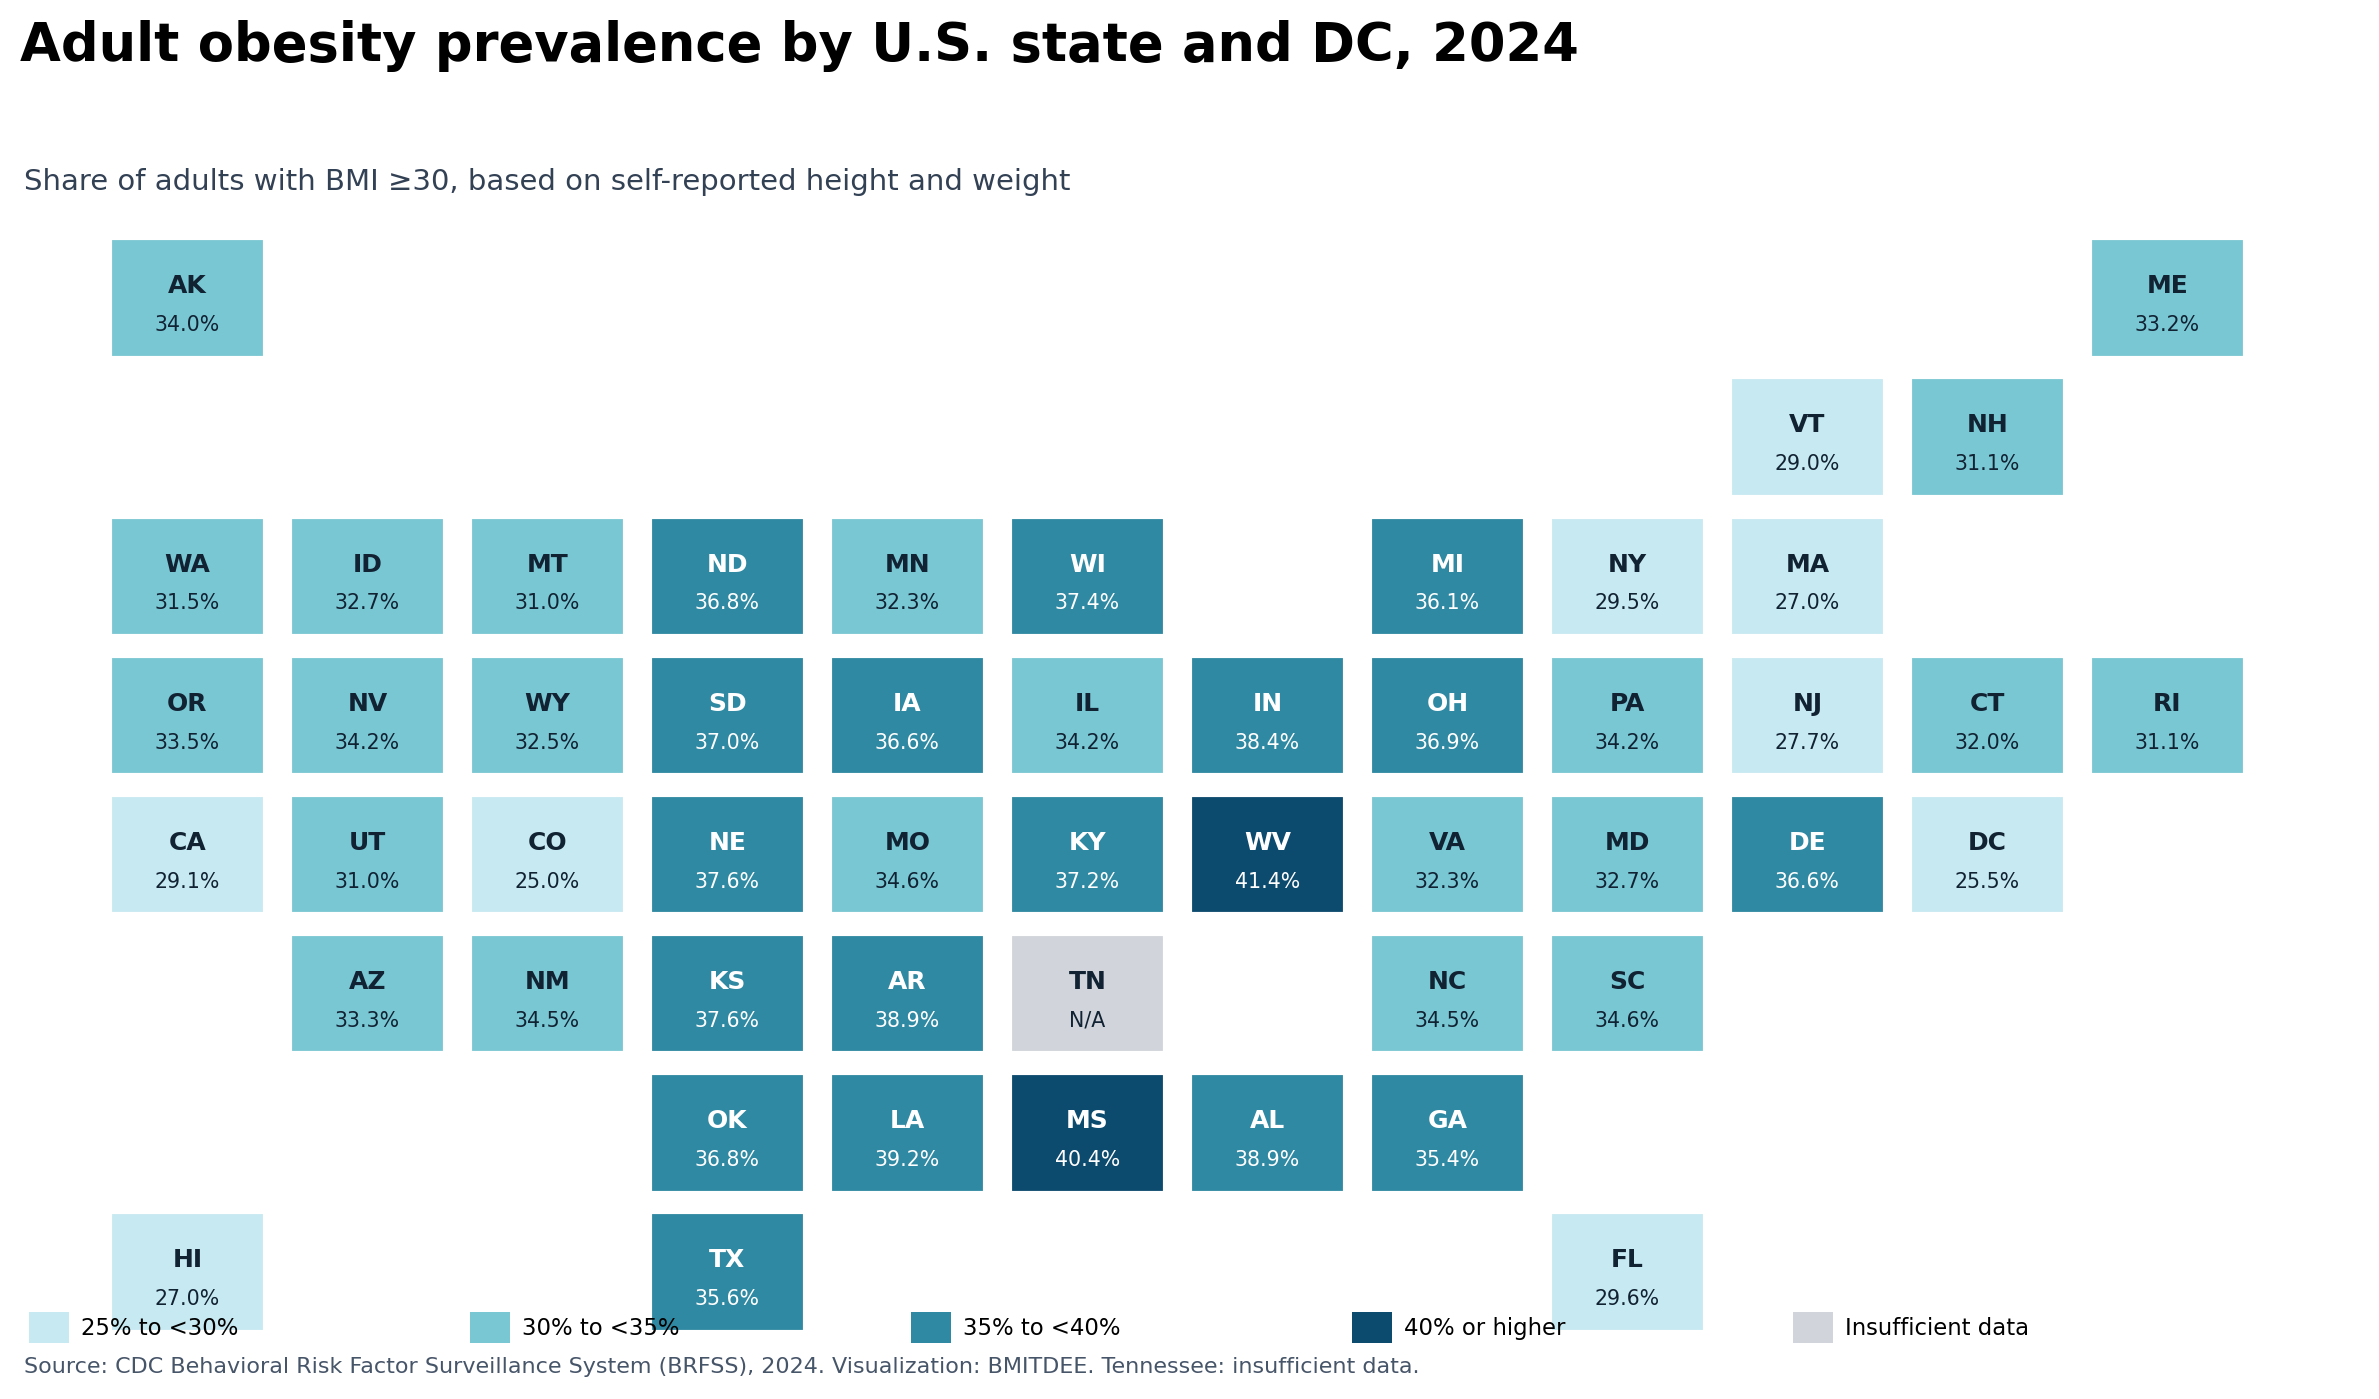
State tile map
Clear category view aligned with CDC thresholds.

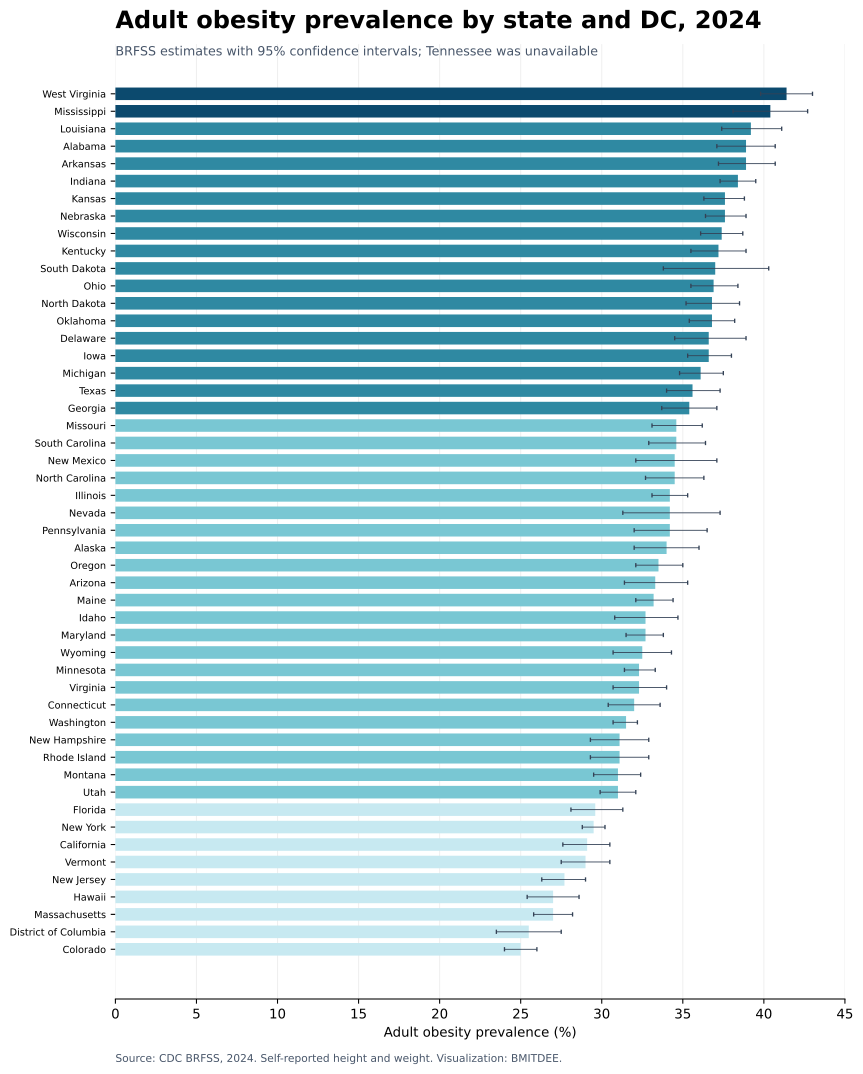
State ranking with confidence intervals
All available states and DC in one chart.
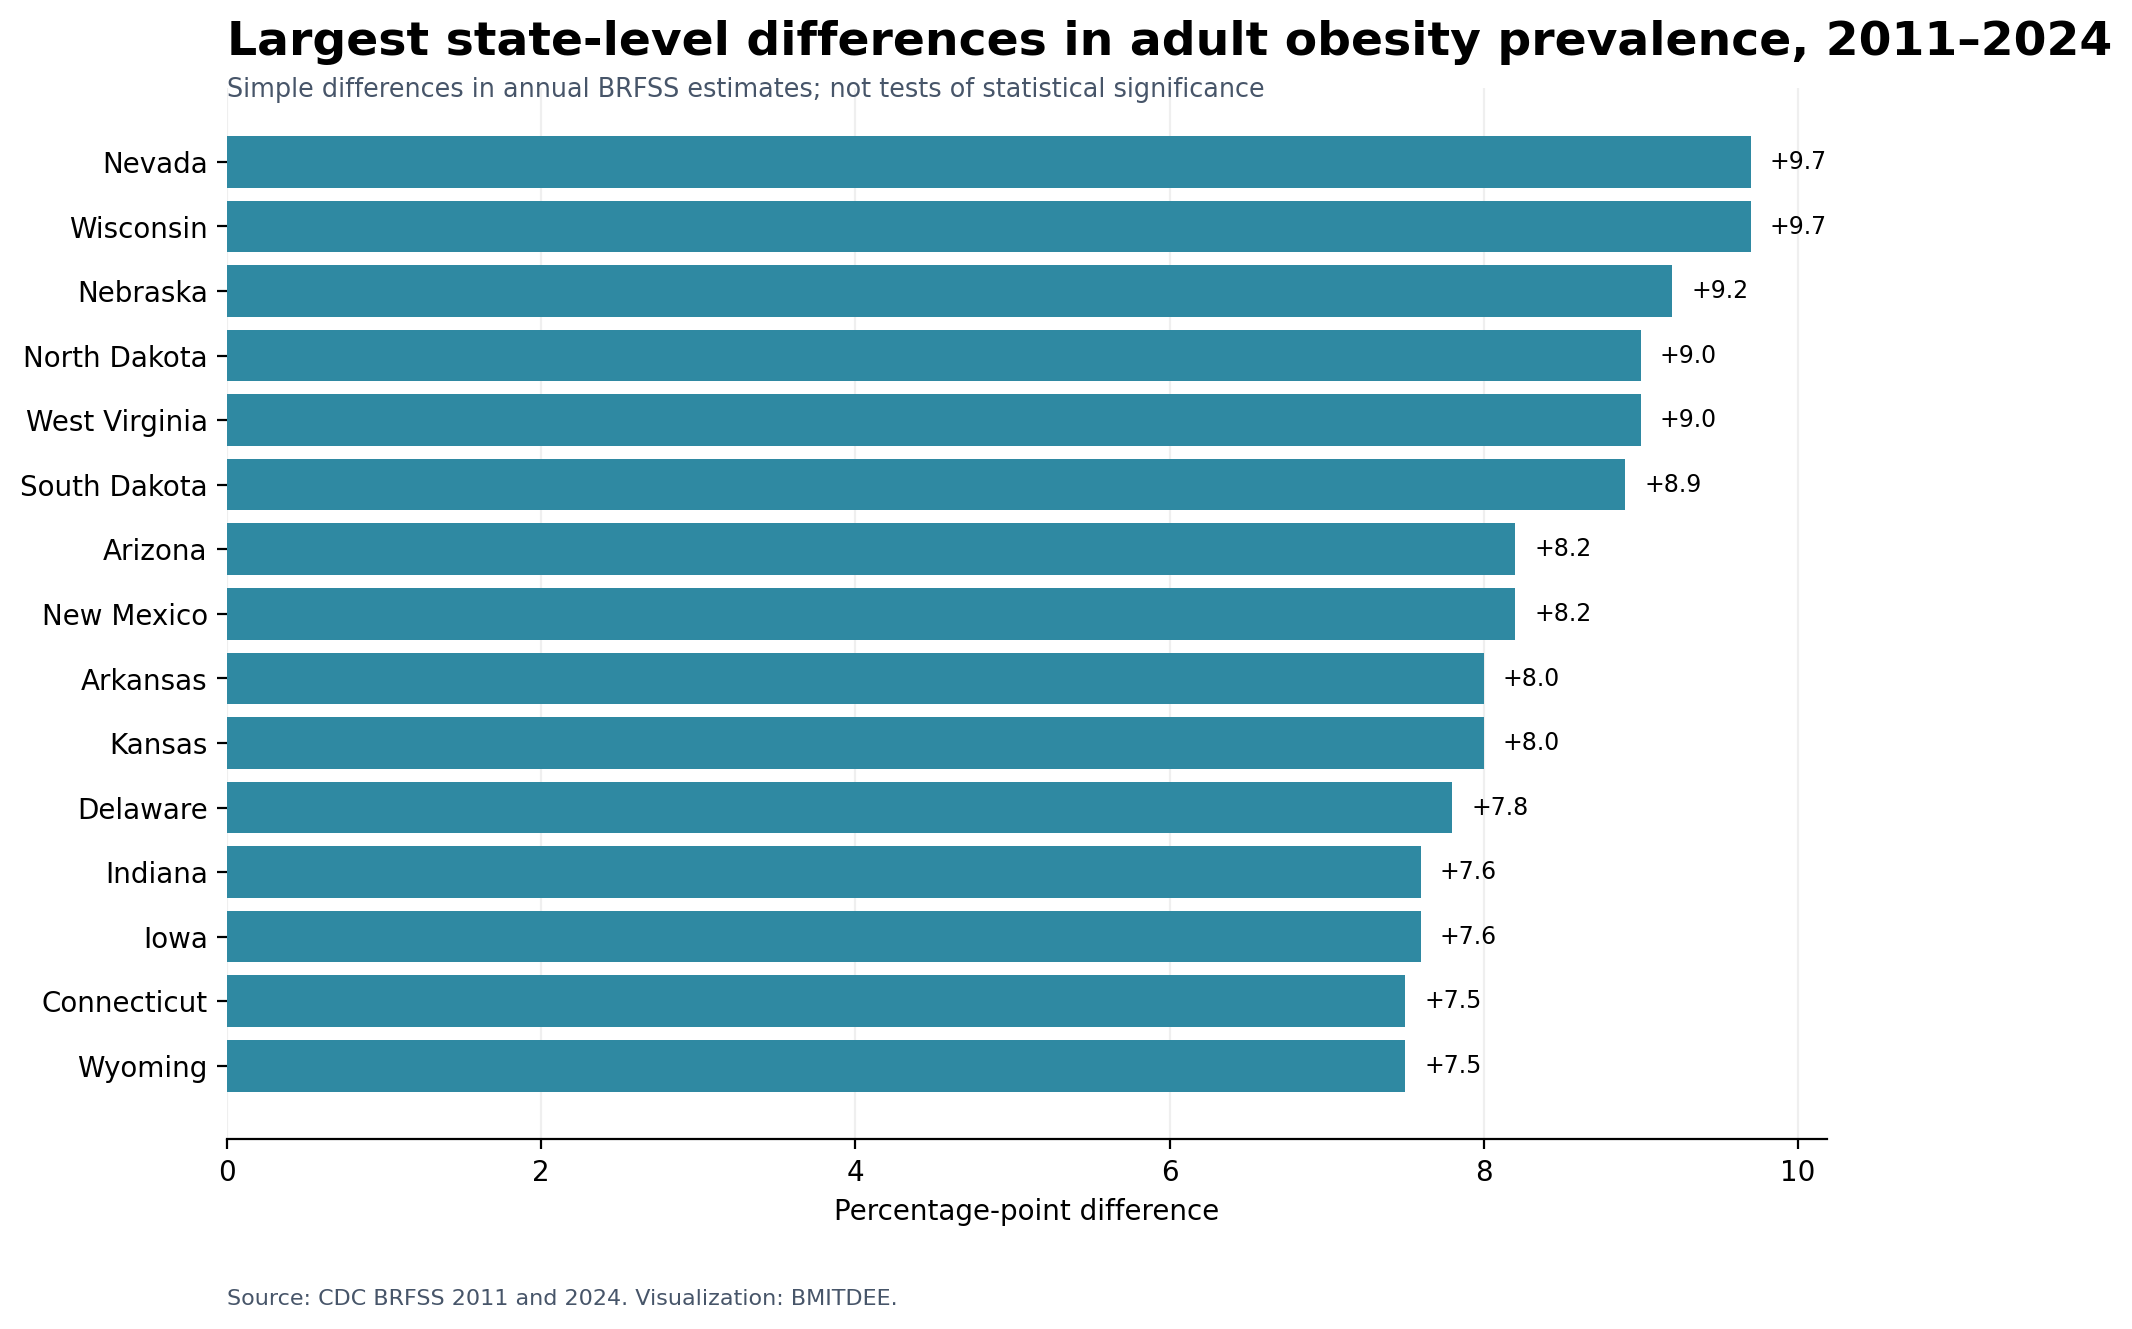
2011–2024 comparison
Descriptive percentage-point differences.
Suggested attribution
Copy-ready summary
What this dataset measures—and what it does not
Source and definition
The original estimates come from CDC's 2024 Behavioral Risk Factor Surveillance System. Adult obesity is defined as BMI at or above 30. BMI is calculated from self-reported height and weight. The page preserves CDC's published point estimates and 95% confidence intervals.
BMITDEE processing
BMITDEE transcribed the CDC state-and-territory table into structured CSV and JSON, assigned Census-style regions for filtering, calculated simple 2011-to-2024 percentage-point differences where both estimates were available, and produced the charts in this package.
Limitations
- Self-reported height and weight may differ from measured values.
- BRFSS estimates are survey estimates, not counts of individuals.
- State rankings can change because of sampling uncertainty; confidence intervals should be reported.
- Simple differences between two annual estimates are not formal trend tests.
- Do not average state estimates to create a national prevalence estimate.
- Tennessee did not meet the published reliability/data requirements for 2024.
Free to reuse with attribution
BMITDEE's original charts, layout and explanatory text in this package may be reused under CC BY 4.0 with attribution. The underlying CDC material remains subject to its own terms and is not owned by BMITDEE. Do not imply CDC endorsement.
Corrections and media requests: replace this line with the final BMITDEE media email before publishing.
Use the package with its definitions attached
These are 2024 BRFSS estimates based on self-reported height and weight. The interactive tile layout is a comparison aid, not a geographic map. BMITDEE is independent and is not affiliated with or endorsed by CDC.